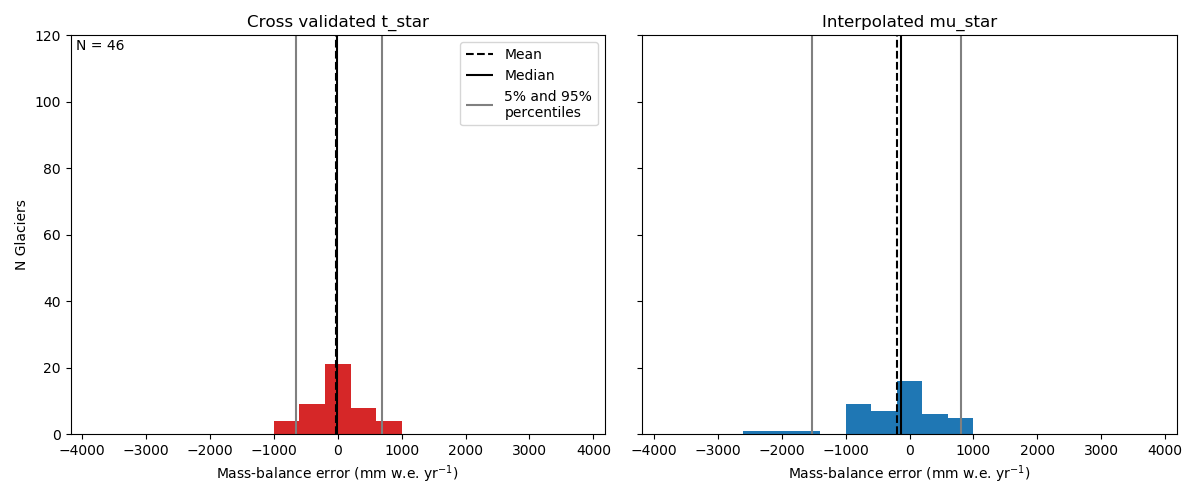
The general overview of each model version first provides a histogram
comparing two different approaches to determine the glaciers temperature
sensitivity parameter. For more information on this see
Maussion et all. (2018), Figure 4.
With Select glacier you can search for and select a specific glacier
and see how the mass balance model performs in its case.
The plots compare the measured annual mass balance on this glacier with two
different OGGM results: For the Calibrated t_star the annual mass
balance is used to calibrate the glaciers temperature sensitivity in a way
that the resulting mass balance bias is 0.
The Crossvalidated t_star does not use the measured mass balance
data and therefore represents true model performance.
All results for the Alpine reference glaciers are calculated with the
ZAMG Histalp data set.
OGGM Version: 1.1.2.dev32+g5620af7-histalp.
Output created: 2019-06-13.
Overview

Some statistics:
Mean t_star bias: -0.00 [mm w.e.] (0 by construction)
Mean crossvalidated bias: -19.49 [mm.w.e]
Mean crossvalidated RMSE: 315.0 [mm.w.e]
Mean crossvalidated correlation coefficient: 0.6
Mean quotient of standard deviations of modeled (crossvalidated) and observed mass balances: 0.8
Used Precipitation Factor: 1.75
Used Liquid Precipitation Temperature: 2.00 [deg C]
Used Melt Temperature: -1.75 [deg C]
Used Temperature Lapse Rate: -6.50 [K/km]

